
Calculating Training ROI for Executive Buy-In: 5 Simple Steps
I’ve had to justify training budgets to executives more than once, and I’ll be honest: if you walk in with “it’ll improve skills,” you’ll get polite nods and nothing else. What works is showing the math—clearly, with assumptions your leaders can actually follow.
In my experience, the fastest way to win executive buy-in is to build an ROI view that connects training to the business outcomes they care about (revenue, cost, risk, speed). When I’ve done this well, the conversation shifts from “Do we like this training?” to “How soon do we see results, and what’s the upside?”
Below are five practical steps I use to calculate training ROI, plus a worked template you can reuse for sales enablement, onboarding, or leadership coaching.
Key Takeaways
Key Takeaways
- Calculate training ROI by comparing all real costs (vendor fees, materials, and employee time) against measurable gains like sales lift, reduced defects, or faster onboarding.
- Include both hard outcomes and soft benefits, but value soft benefits using a defensible method (not vibes). Better retention, reduced rework, and fewer errors can be converted into dollars.
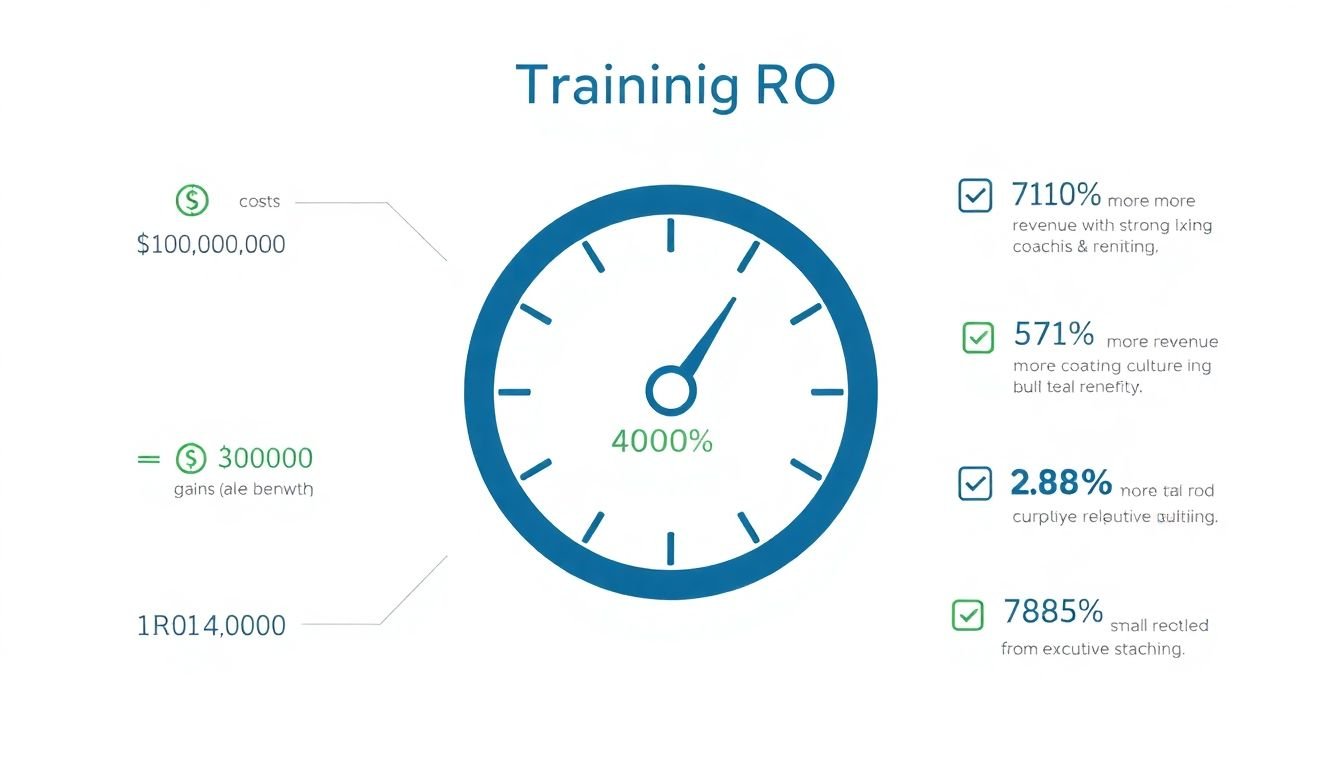
- Use the simple formula: ROI = (Gains – Costs) / Costs x 100%. The key is transparency—show exactly what you counted and what you didn’t.
- Back your numbers with relevant, verifiable sources and internal data (before/after, cohort comparisons, or a control group when possible).
- Track results with the right KPIs and a baseline period. Then attribute changes to training using a practical approach (control group, matched cohorts, or difference-in-differences).
- Follow a repeatable workflow: gather costs, define outcomes, estimate value (including soft benefits), compute ROI, and present it in a way executives can skim.
- Avoid common pitfalls like double-counting benefits, using vanity metrics (like “course satisfaction”), or ignoring the time horizon to impact.
- Use technology (LMS, HRIS, CRM, dashboards) to pull data consistently so you’re not building spreadsheets from scratch every time.
- Set expectations. If impact takes 3–6 months, show a staged ROI forecast instead of forcing everything into one quarter.
- Make the story match the business goal. Executives don’t fund training—they fund outcomes. Your ROI slides should prove the link.

Calculate Training ROI to Gain Executive Support
If you’re trying to get leadership onboard with training, start with the question executives are already thinking: “What changes in the business because we funded this?”
Here’s how I’d frame it in a first pass. I collect the costs first (so I’m not guessing later):
- Vendor/trainer fees and licensing
- Materials (manuals, software seats, assessments)
- Employee time (hours in training + prep + practice)
- Any travel or facilitator costs
Then I compare those costs to measurable gains. For example, with sales enablement, I’ll look at metrics like win rate, average deal size, and cycle time—not just “they liked the workshop.”
In one rollout I supported, the training cost was about $50,000 for a cohort of reps. The team’s CRM showed that, over the next quarter, deals closed faster and with higher conversion. When we translated those improvements into incremental revenue (and used only the part we could reasonably attribute to the training), the upside came out to roughly $200,000. That’s when leaders stopped asking “is it worth it?” and started asking “can we scale it?”
And yes—soft benefits matter too. Faster onboarding, fewer mistakes, improved confidence, better manager coaching behaviors… those are real. The trick is valuing them with a method (more on that below) instead of tossing in “morale went up” as if that equals dollars.
Understand Why ROI is Important for Executives
Executives don’t need training theory. They need a decision tool. ROI gives them a simple story: “If we spend X, what do we get back—and when?”
In coaching and leadership development, ROI claims are often dramatic, but the underlying reason executives care is practical: coaching can reduce performance gaps and turnover risk. For example, the International Coach Federation (ICF) has published research on executive coaching outcomes and ROI. Their work is one reason you’ll see numbers like “7x” referenced in executive coaching discussions (you should still validate the exact study and context before you quote it in your own business case).
What I’ve found works best is using ROI to connect training to one of these executive priorities:
- Revenue growth (more wins, higher deal sizes, better retention of customers)
- Cost reduction (fewer errors, less rework, lower churn)
- Speed (shorter onboarding, faster time-to-competency)
- Risk (compliance adherence, fewer incidents)
When you align your training goals to a specific business outcome, ROI becomes less about “learning” and more about performance. That’s the translation executives want.
Simplify the ROI Calculation with a Clear Formula
Let’s keep the math simple. The standard formula you’ll see everywhere is:
ROI = (Gains – Costs) / Costs x 100%
Here’s a quick example using numbers I’d actually include in a slide deck. Suppose your leadership program costs $10,000 total (facilitator fees, materials, and employee time). After the program, your team hits $50,000 in incremental value over the chosen time horizon (maybe reduced rework, improved project throughput, or reduced turnover risk). Your ROI is:
ROI = (50,000 – 10,000) / 10,000 x 100% = 400%
Two practical notes from my own ROI work:
- Time horizon matters. If impact shows up over 6–12 months, don’t pretend you’ll capture it all in month one. I usually show ROI in phases (e.g., “early impact” and “full-year impact”).
- Costs should be complete. If you only include vendor fees, your ROI will look inflated. Executives notice when employee time is missing.
When you’re valuing productivity improvements, you’ll often estimate based on hours saved or time-to-competency. That’s fine—just make your assumptions explicit.
Use Real Data and Examples to Strengthen Your Case
Here’s the problem with many ROI arguments: they quote big external stats but don’t tie them to their own situation. Don’t do that. Use external benchmarks only as context, then let your internal numbers do the heavy lifting.
For example, if you’re presenting a sales enablement ROI, you can cite external research about how coaching or capability building impacts performance, but your “proof” should come from your CRM or sales ops data (win rate, deal velocity, pipeline coverage) before and after training.
Let me show two worked scenarios—one sales-focused and one onboarding-focused—so you can see how assumptions should be stated.
Scenario A: Sales enablement (revenue lift)
- Training: 1-day sales skills program + follow-up coaching
- Cohort size: 40 reps
- Time horizon: 90 days after training
- Costs: $50,000 total (facilitator + materials + rep time)
- Observed KPI change: Win rate increases from 18% to 20% on deals in the cohort’s pipeline
- Attribution approach: Compare to a similar rep group that didn’t take the training that quarter (or use matched historical performance)
Value estimate (example math):
- Average qualified pipeline per rep in the period: $400,000
- Incremental win-rate change: +2 percentage points (0.02)
- Incremental revenue per rep: $400,000 x 0.02 = $8,000
- Incremental revenue for 40 reps: $8,000 x 40 = $320,000
- Attribution factor (realistic adjustment): assume 70% of the lift is attributable to training (rest could be market/seasonality)
- Attributed gains: $320,000 x 0.70 = $224,000
ROI: (224,000 – 50,000) / 50,000 x 100% = 348%
Notice what I did: I didn’t claim the entire $320,000 lift was training. I used an attribution factor so the story stays credible. Executives prefer “defensible” over “perfect.”
Scenario B: Onboarding (reduced turnover + time-to-productivity)
- Training: New manager onboarding program + role-based learning paths
- Cohort size: 60 new managers
- Time horizon: 6 months for turnover impact; 12 months for full productivity
- Costs: $30,000 total
- Observed KPI change: New hire turnover drops from 20% to 12% within 6 months
- Attribution approach: Compare to the previous cohort (or a matched group in a similar region)
Value estimate (retention cost model):
- Number of hires: 60
- Turnover reduction: 20% – 12% = 8% of 60 = 4.8 fewer leavers (round to 5 for planning)
- Estimated cost per replacement (recruiting + ramp + lost productivity): $25,000
- Gains from reduced turnover: 5 x 25,000 = $125,000
Optional productivity value: If training reduces time-to-competency by 2 weeks and managers generate ~$6,500 in value per week, then:
- 2-week improvement x 60 managers x $6,500/week = $7,800,000 in “gross” value
- But don’t dump the full number into ROI. Use a conservative capture rate (say 10–15%) to reflect that value accrues gradually.
- At 12% capture: $7,800,000 x 0.12 = $936,000
ROI (using only retention for conservatism): (125,000 – 30,000) / 30,000 x 100% = 317%
This is exactly the kind of “defensible conservatism” executives appreciate. You’re not hiding behind optimistic assumptions—you’re choosing a method you can defend.
Discover How to Track Quantifiable Outcomes Effectively
Tracking training impact gets easier when you decide up front what “success” means. Not “completion rates.” Not “engagement.” Actual business outcomes.
Here’s the measurement plan I recommend (and use):
- 1) Choose a baseline period: I like 4–8 weeks before training for operational KPIs (or the most recent quarter if seasonality is strong).
- 2) Define KPIs precisely: For sales: win rate, average deal size, sales cycle length. For onboarding: time-to-productivity, early attrition, ramp milestones. For leadership: performance ratings, project delivery metrics, retention of direct reports.
- 3) Pick data sources: CRM (sales), HRIS (retention), LMS (completion and assessment), project management tools (delivery timelines), quality systems (defect rates).
- 4) Decide on attribution: Best case is a control group (or staggered rollout). If you can’t, use matched cohorts or difference-in-differences (compare change over time versus a comparison group).
- 5) Control for confounders: If a compensation plan changed or product pricing shifted during the measurement window, note it. Sometimes you adjust attribution or shorten the horizon to isolate training effects.
Let’s make it concrete. Suppose onboarding training is intended to reduce early turnover. You might see turnover drop from 20% to 12%. That’s measurable. But you still need to answer: was the labor market different, or did hiring standards shift? If you can’t fully control it, you can still present ROI as a “conservative estimate” and show sensitivity ranges (e.g., what if the true attributable effect is only half of the observed change?).
That’s how you keep your ROI credible instead of fragile.
Set Practical Steps to Calculate Your Training ROI Step-by-Step
Now for the repeatable workflow. This is the template I’d hand to someone on my team and expect them to produce a leadership-ready ROI estimate.
-
Gather all training costs (include real time): trainer/vendor fees, materials, software licenses, travel, and employee time. For employee time, I usually use an hourly cost rate (salary/annual working hours) and multiply by hours spent in training + prep.
-
Define tangible benefits tied to business KPIs: pick 1–3 outcomes you can measure. Examples: increased revenue per rep, reduced defect rate, lower turnover, faster time-to-competency.
-
Value soft benefits using a method, not a guess: pick one approach that matches your outcome.
- Retention cost model: value reduced turnover by multiplying fewer leavers by cost per replacement (recruiting, ramp time, lost productivity).
- Productivity hour model: value time saved by multiplying hours saved by loaded cost per hour (and apply a capture rate).
- Error/rework model: value fewer mistakes by multiplying defect reduction by cost per defect (labor + rework + customer impact where applicable).
Want a sample quick calculation? If training reduces rework by 120 hours per month and your loaded labor cost is $60/hour, that’s $7,200/month in value. Over 6 months: $43,200 (before capture adjustments, if needed).
-
Compute ROI with transparency: ROI = (Gains – Costs) / Costs x 100%. Show your gains in the same slide as the assumptions (time horizon, cohort size, KPI change, attribution factor).
-
Present it in an executive-friendly format: one slide for the headline ROI, one slide for the assumptions, and one slide for how you’ll measure in the future. Executives want to know what would make the number go up or down.
That’s it. It’s not complicated—just structured. And structure is what turns “training talk” into an actual investment decision.
Show the Strategic Value of Training Beyond Just Numbers
ROI is the headline, but strategic value is what helps you defend the decision when someone asks, “What if the numbers are mixed?”
Here are the strategic angles I’d actually include:
- Leadership bench strength: training that reduces time to fill critical roles or improves internal mobility.
- Risk and compliance readiness: fewer incidents, better audit outcomes, lower exposure.
- Change adoption: faster rollout of new tools/processes, measured by adoption rates and cycle times.
- Capability building: improved coaching behaviors, measurable through manager checklists or 360 feedback trends.
A simple way to present this: use ROI for the financial decision, then add a “strategic resilience” section that explains why the investment still matters even if impact takes longer to show up.
Gather and Present Data with the Help of Technology Platforms
You don’t need fancy tools, but the right ones save hours and reduce errors. In practice, I usually rely on three layers:
- LMS reporting: completion rates, assessment scores, and training engagement. If you want a starting point for choosing an LMS, see best LMS for small business.
- Operational systems of record: CRM for sales, HRIS for retention/turnover, ticketing/quality systems for defects and rework.
- Dashboards: a simple BI dashboard that shows KPI trends before/after training for the cohort.
The big win is consistency. When you pull the same KPI definitions every time, your ROI story doesn’t change depending on who built the spreadsheet.
Avoid Pitfalls When Presenting ROI to Leaders
Most ROI decks fail for avoidable reasons. Here are the pitfalls I’d actively watch for:
-
Double-counting benefits: Example: you count reduced turnover and also count “lower hiring costs” separately when those are already included in your turnover cost model. Fix: define what each value line covers and don’t overlap.
-
Vanity metrics as ROI: “Course satisfaction went up 20%” is nice, but it’s not ROI. Fix: treat learning metrics as drivers, not outcomes. Your ROI needs business KPIs.
-
Ignoring time-to-impact: Leadership coaching often takes months to show in performance. Fix: show staged ROI (e.g., 90-day early indicators + 6–12 month final impact).
-
Cherry-picking the best-performing cohort: Fix: use pre-defined cohorts and keep the comparison group consistent.
-
Missing costs: If you leave out employee time, your ROI looks inflated. Fix: include time and clearly state the hourly rate assumption.
-
No attribution plan: Fix: use a control group, matched cohort, or difference-in-differences. If you can’t do rigorous attribution, at least include an attribution factor and explain it.
When you avoid these traps, your ROI isn’t just persuasive—it’s durable.
Set the Right Tone and Approach for the ROI Conversation
Here’s how I’d handle the meeting. Start with the business outcome, not the course agenda.
Try this structure:
- Business goal: “We want to reduce onboarding time and early turnover.”
- Training intervention: “We’re rolling out a role-based onboarding program for new managers.”
- Measurement plan: “We’ll track turnover at 6 months and time-to-competency milestones, compared to the previous cohort.”
- ROI estimate: “Based on current baseline and conservative attribution, expected ROI is X% over 6 months.”
- Assumptions: “Here’s what’s included/excluded, and what would change the number.”
And one more thing: executives don’t want a lecture. They want clarity. If you can answer “What would make you wrong?” you’ll sound credible fast.
FAQs
Because it turns training from an expense into a decision. ROI quantifies benefits against costs, so executives can justify the investment and compare it to other priorities.
Use the basic formula: ROI = (Net Benefits from Training / Total Training Costs) x 100. It produces a clear percentage return you can communicate quickly.
Pick specific outcomes and tie them to measurable business results (with a baseline and a comparison group when possible). That’s what makes the impact believable—not just the training attendance.