
Providing Tactile Graphics for STEM Subjects: How to Improve Learning
STEM can be tough even when you’re sighted—now imagine trying to learn geometry, chemistry, or circuits without being able to “see” the diagrams. That’s where tactile graphics come in. They turn those flat, visual-only pictures (graphs, diagrams, cross-sections, maps) into something students can actually explore with their hands.
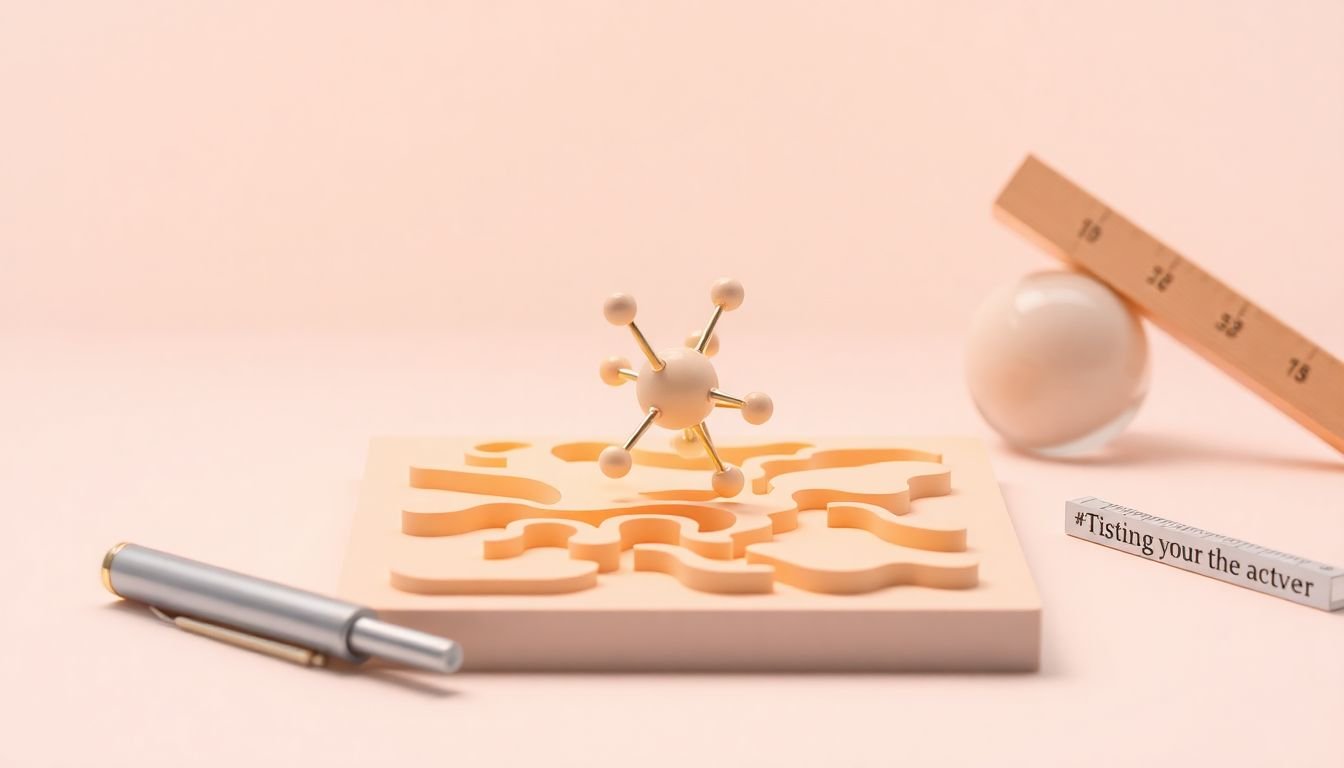
In my experience, the difference is immediate once students can trace a shape, feel the spacing between parts, and understand direction using touch instead of guesswork. A tactile solar system diagram, for instance, isn’t just “a picture you can touch.” It becomes a model students can compare—planet sizes, orbital spacing, and relative distance all become tangible.
And yes, you can start making tactile graphics without fancy equipment. You can begin with swell paper, hand tooling, or simple thermoformed overlays. If you need durable, repeatable classroom sets, 3D printing and embossing gear make a huge difference.
If you want to build tactile activities that match your curriculum (instead of adding “random extra stuff”), resources like lesson planning techniques are a good place to start.
Key Takeaways
- Design for touch first. Use raised lines and textures to represent structure (not “pretty shading”). In practice, I’ve found that consistent line thickness and clear spacing matter more than adding extra detail. If students can reliably tell what’s connected vs. separate, spatial understanding improves and confidence follows.
- Use tactile graphics where spatial reasoning is the bottleneck. Geometry, maps, circuit layouts, molecule shapes, and diagram labeling are the sweet spots. Pair the tactile graphic with short, scripted explanations (like “Find the node at the top-left, then trace the path clockwise”). That combination helps students build mental models instead of just touching shapes.
- Choose production tech based on volume and durability. For one-offs, traditional methods (swell paper, hand tooling, foil embossing) can work fast. For classroom sets, thermoforming/embossing and 3D printing are usually worth it. What I noticed: 3D prints shine for multi-dimensional forms (DNA, terrain, anatomical cross-sections), while embossers are great for diagrams with lots of repeated copies.
- Simplicity beats “more information.” Tactile learners can get overwhelmed when everything is raised. A practical rule: keep only the features students must use to solve the task. If you need depth, use 2–3 tactile depth levels (for example: main structure, secondary structure, labels/legend).
- Accessibility is a process, not a one-time add-on. Involve students with disabilities in feedback, train teachers on tactile conventions, and keep the materials consistent across units. When students know the “system” (how labels work, how legends work, what textures mean), they spend less effort decoding and more effort learning.
Provide Tactile Graphics for STEM Subjects
Tactile graphics help students with visual impairments access the “diagram thinking” that STEM depends on. Instead of trying to interpret a complex figure from text descriptions alone, students can feel raised lines, textures, and shapes that represent the same information.
Here’s a concrete example from what I’ve seen work in classrooms: a tactile solar system model. When the planets are raised to distinct sizes and the orbital paths are clearly separated (with consistent spacing), students can compare distances and relative order without needing to memorize a verbal explanation that changes from teacher to teacher.
To make tactile graphics, you’re essentially translating visual elements into touch cues:
- Lines become raised paths (solid vs. dashed can map to different textures).
- Areas become raised regions or blocks (for shapes, layers, or regions).
- Labels become Braille/raised text and a legend when needed.
- Depth is used sparingly to avoid confusion (more depth isn’t always better).
You can create tactile diagrams using multiple methods—hand tooling on swell paper, thermoforming/embossing, or 3D printing. The “right” method depends on how many copies you need, how long the materials must last, and how complex the geometry is.
One practical tip I swear by: introduce tactile graphics early in the year. If students already know how to read tactile diagrams (how to start at the title, how to scan left-to-right, how to use the legend), they’ll waste less time decoding and more time learning the actual STEM concept.
Explain How Tactile Graphics Improve STEM Learning
When tactile graphics work well, they don’t just “help.” They change what students can do independently. STEM is full of abstract relationships—angles, connectivity, direction, structure—and touch is surprisingly good at representing those relationships when the design is clear.
In my experience, students gain two big things:
- Spatial relationships become easier to reason about. Geometry figures, topographical maps, and circuit layouts rely on understanding where things are relative to each other.
- Students can verify their own understanding. Instead of asking “Is this the right part?” they can trace, compare, and check.
Research backs up the general idea that students with visual impairments may face extra challenges with spatial and directional concepts. For example, a commonly cited theme in the tactile graphics and accessible STEM literature is that tactile input helps build spatial representations when visual cues are unavailable. One useful starting point for educators is the work summarized by the field’s key organizations on tactile graphics and STEM accessibility, such as:
- AFB (American Foundation for the Blind) — Using tactile graphics
- Braille Authority of North America (BANA)
Note: exact effect sizes vary by study and age group, and not every paper isolates “tactile graphics” as the only variable. Still, the consistent takeaway is that tactile representations support access to diagram-based content and can reduce reliance on verbal-only explanations.
Here’s an “extra tip” that makes a real difference during instruction: don’t just hand over the graphic and hope. Pair it with a short, repeatable interaction routine. For example:
- “Find the title.”
- “Trace the main outline once.”
- “Locate the legend and match symbols.”
- “Answer the question by tracing to the correct feature.”
If you want more lesson integration ideas, effective teaching strategies can help you structure those routines so they’re not awkward or time-consuming.
Identify Key Technologies for Creating Tactile Graphics
You don’t have to be a maker or a designer to start. But choosing the right technology does matter, because tactile readability depends on how reliably you can create consistent raised features.
Traditional methods (fast, low-cost, great for prototypes)
Hand-tooling and swell paper are useful for quick experiments or one-off diagrams. They’re also great when you’re still figuring out what information should be tactile vs. what should be described verbally. The tradeoff? Production time and consistency can be tough if you’re making a large set for a whole class.
Thermoforming and embossing (best for classroom sets)
For repeated use, embossing and thermoforming machines can produce clearer, more durable graphics. Tools in this category (often referenced in tactile graphics classrooms) are designed to raise specific areas so students can feel boundaries and structures without the image “collapsing” under touch.
What I noticed with embossing-style outputs: crisp edges and consistent line height make a big difference. If line height varies too much, students start misreading features (especially intersections and small text).
3D printing (ideal for multi-dimensional STEM models)
3D printing is where tactile graphics get really exciting for STEM. You can print:
- Raised molecular structures (atoms as nodes, bonds as connectors)
- Topography and terrain cross-sections
- Geometric solids (nets, prisms, spheres with labeled cutaways)
Limitations? Small details can be fragile. Also, some students need time to learn how the “scale” translates to touch—so it helps to include a tactile ruler or scale reference on the print.
Interactive tactile displays (touch + visual cues)
There are also tactile display approaches that combine touch feedback with visual overlays. These can be useful for mixed classrooms where sighted peers and visually impaired students collaborate. Just make sure you evaluate them based on your real constraints: cost, training time, and whether the device produces tactile cues that match your lesson goals.
If you’re planning how to demonstrate tactile graphics to students or families, ideas for content creation can help—see how to create educational video.
Address Challenges and Current Research in Tactile Graphics
Let’s be honest: tactile graphics aren’t automatically easy. The hard part is not “making something raised.” The hard part is making something readable and useful for the exact task students are trying to do.
Common problems I’ve seen (and how to fix them)
- Too much detail. If everything is raised, nothing is meaningful. I usually strip the diagram down to only what the question requires.
- Inconsistent tactile conventions. If one worksheet uses texture A for “distance” and the next uses it for “height,” students lose time decoding.
- Cost and turnaround time. Even when materials are affordable, production and revisions take time—especially if you’re iterating based on student feedback.
On the research and development side, the field is actively working on making tactile graphics more scalable and adaptable. For example, educators and institutions often discuss workflow improvements and production support (including course and lesson planning systems that can help structure accessible materials). You can see examples of workflow-oriented guidance through resources like source, source, and source.
One current push in accessible STEM is better conversion workflows—turning digital diagrams into tactile-ready formats faster. That matters because teachers don’t have unlimited prep time, and “good enough for one class” doesn’t help when you need consistent materials across sections.
Mini design checklist (use this before you print/emboss):
- What is the learning goal? (If you can’t state it, the tactile graphic will drift.)
- Which features must be tactile for students to answer the question?
- Are line thicknesses consistent for each “type” of feature?
- Is spacing large enough to separate close elements?
- Do you include a legend for symbols/texture meanings?
- Did you test a “cold read” (hand it to someone who hasn’t seen it yet) to catch confusion?
In my own pilot work, the biggest improvements came from testing readability—not from upgrading hardware. A small change like increasing spacing between two intersecting lines or simplifying a label set improved comprehension more than adding extra decorative texture.
Encourage Inclusive Practices in STEM Education
Tactile graphics are one piece of inclusion. The bigger win is how you build STEM lessons so all students can participate—without making accessibility feel like a special favor.
Here’s what inclusive practice looks like in real life:
- Co-design with students. When students with disabilities review tactile materials, they can point out what’s unclear immediately. That feedback loop is hard to replicate if you only rely on assumptions.
- Train teachers on the “how,” not just the “what.” If teachers don’t know how to introduce a tactile diagram, students can end up frustrated even with a well-made graphic.
- Keep tactile conventions consistent across lessons. Legends, symbol meanings, scanning routines, and label formats should stay stable.
- Collaborate with developers. If you’re building tactile circuit boards or molecular models, working directly with people who understand both STEM content and tactile accessibility helps avoid “almost works” designs.
For ideas on building those routines and classroom structures, source can be useful. And for involving students and writing accessibility into your planning, source is another place to look.
One thing I’ve noticed in mixed-ability groups: peer learning works best when roles are clear. Give sighted students a job like reading the legend aloud, and give tactile-first students a job like tracing the path or identifying the structure. Everyone contributes. Everyone learns.
FAQs
Tactile graphics are raised visuals that students can explore by touch. In STEM, they translate diagrams and figures—like graphs, circuits, geometry shapes, and maps—into formats students can feel, so they can understand structure and relationships without relying only on verbal descriptions.
Tactile graphics help students access abstract, diagram-based content by turning it into something they can actively explore. That supports comprehension and retention because students can build mental models through touch-based feedback, not just read about concepts secondhand.
You’ll see tactile graphics made using 3D printers, embossing devices, and specialized software workflows (including tools that help prepare tactile layouts and labels). Traditional methods like swell paper and hand tooling are still common for smaller projects or early prototypes.
The big challenges are cost, time, and design readability. Teachers also need support to integrate tactile graphics into instruction effectively—otherwise students might struggle to interpret the materials. Planning for training, consistent tactile conventions, and student feedback is usually what solves the “it’s made, but it’s not working” problem.