
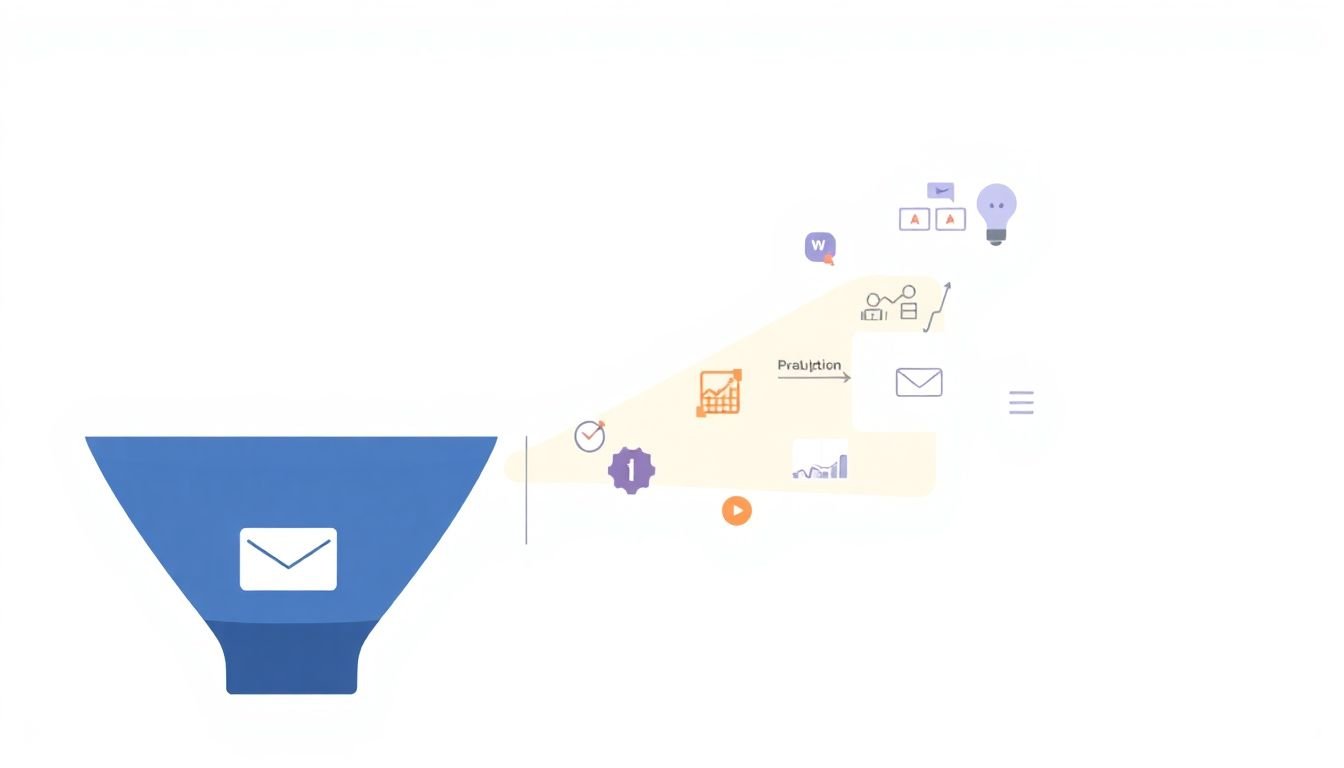
Attribution Modeling for Course Marketing Spend: 6 Simple Steps to Improve Results
I know how annoying it is when you’re paying for ads and you can’t tell which parts of your marketing are actually driving course sign-ups. I’ve been there—spending a week “optimizing” campaigns based on clicks, only to realize the conversions were happening later (and often somewhere else). That’s exactly where attribution modeling comes in. It helps you connect the dots between the touchpoints a prospective student hits and the enrollment you care about.
In this post, I’ll walk you through a straightforward 6-step setup I’ve used for course funnels—what to track, how to pick an attribution model that fits your journey, and how to turn the results into budget decisions. Along the way, I’ll include a real-world example scenario (with numbers) and the specific checks I run to make sure tracking isn’t lying to me.
By the end, you’ll have a practical plan you can implement this week: identify touchpoints, set up tracking, choose a model, and start reallocating spend based on evidence—not vibes.
Key Takeaways
- Map your real touchpoints (ads, emails, blog posts, webinars, referrals). Then track which ones actually correlate with sign-ups using UTM links and analytics.
- Pick an attribution model that matches your funnel: time decay for shorter “research windows,” position-based when first/last interactions matter, multi-touch when students need multiple nudges.
- Set up tracking correctly with Google Tag Manager + pixels (Facebook Pixel / Meta) and conversion events. Test UTMs and event firing before trusting any reports.
- Use attribution to improve conversions: double down on channels that contribute to enrollments (not just clicks), and run split tests on the assets that show up in high-credit paths.
- Review regularly and refine: quarterly model checks, messaging consistency across touchpoints, and adjustments when platforms or student behavior change.
- Use specialized tools if you need deeper multi-touch tracking and reporting—just don’t skip the basics (UTMs + conversion event QA) first.

Step 1: Identify Key Touchpoints in Course Marketing
Before you pick a model, you need to know what you’re attributing. I start by listing every place a prospective student could realistically touch my funnel. That usually includes:
- Paid ads (Meta, Google Search, YouTube)
- Organic social posts and boosted reels
- Blog posts and SEO landing pages
- Email nurture (welcome series, webinar reminders, “last chance”)
- Webinars / live workshops
- Retargeting ads
- Partnerships, affiliates, or referrals
Then I narrow it down to the touchpoints that can influence enrollment. Here’s a scenario I’ve seen a lot with course funnels: your Facebook ads get the first visit, but the enrollment happens after someone reads a blog guide and then clicks through an email.
Instead of guessing, map it. In my spreadsheet, I track touchpoints like “FB Ad → Blog Guide → Email Day 3 → Enrollment.” Once you can see the journey patterns, attribution becomes way less abstract—and your budget decisions get easier.
Next, use UTM parameters on every link you control (ads, email buttons, banner links). A simple naming convention goes a long way. For example:
- utm_source: facebook, newsletter, google
- utm_medium: cpc, email, organic
- utm_campaign: course_launch_spring_2026
- utm_content: ad_variant_a, email_day3_cta
Finally, make sure your analytics tool can actually connect the dots across sessions. If you’re using Google Analytics, set up your measurement so you can see the path leading to “Course Enrollment” (or whatever your primary conversion event is). Prioritize the touchpoints that show up in the conversion paths—not the ones that just look busy.
Step 2: Choose the Right Attribution Model for Course Marketing
Attribution models aren’t just math—they change the story you tell yourself about what’s working. In my experience, the “best” model is the one that matches your student decision process.
Use this quick rubric:
- Last-click: Use when your sales cycle is short and the final click is usually the decisive step (think: direct response landing pages, same-week enrollments).
- First-click: Use when awareness is the hardest part and the first interaction strongly predicts later intent (top-of-funnel channels that consistently start the journey).
- Time decay: Use when the window is tight (example: people enroll within ~1–7 days). More recent touches should get more credit.
- Position-based: Use when both the first and last touch matter. Typically, you credit 40% to the first touch, 40% to the last touch, and split the remaining 20% across middle touches (the exact split can vary, but that’s the common structure).
- Multi-touch: Use when students need multiple nudges (ads to blog to email to webinar). This is the “most realistic” view for many course funnels.
When do you use data-driven attribution? I treat it like a “minimum volume” problem. If you don’t have enough conversion events, the model won’t learn stable patterns. A rule of thumb I use: aim for at least 200–500 conversion events per month for the primary conversion window you’re analyzing. If you’re way below that, start with position-based or time decay and improve tracking first.
Also, don’t blindly copy what you see in platform defaults. Google’s documentation and research on attribution modeling consistently emphasize that the model choice affects conclusions, and that data availability matters (for example, platform-specific requirements for data-driven attribution). The point isn’t to chase the “perfect” model—it’s to pick one you can defend and improve over time.
Step 3: Set Up Accurate Tracking for Course Campaigns
This is where most attribution projects quietly fall apart. So I’m picky here.
At minimum, you want to track:
- Page views / landing page views (with UTM context)
- Key engagement events (video play, webinar registration, pricing page view)
- Form submits (lead capture)
- Enrollment conversion (thank-you page view or purchase/enroll event)
Implementation-wise, I typically use Google Tag Manager to fire events and pass UTMs into events where possible. If you’re on Meta, you’ll also want Facebook Pixel (or the Meta Pixel via GTM) to capture the same enrollment event.
Here’s the checklist I actually run before trusting results:
- UTM sanity test: click a tagged link (incognito), verify utm_source/utm_medium/utm_campaign show up on the landing page session.
- Event firing test: use Tag Assistant / preview mode to confirm enrollment event fires once (not 0 times, not 3 times).
- Deduping check: if you have both Pixel and server-side tracking, make sure you’re not double-counting conversions.
- Attribution window alignment: confirm that your reporting window (e.g., 7-day click, 1-day view) matches how you plan to make decisions.
If you’re running email campaigns, don’t rely on “email = newsletter.” You need UTM parameters on the links inside the email. Otherwise, your email touchpoints are basically invisible to attribution.
And yes, advanced tools can help with multi-touch analysis. But I’d rather see you get the basics right first. If you want deeper tracking and mapping, you can look at Voluum and OWOX (as starting points for exploring options). Still, the fundamentals—UTMs, correct conversion events, and QA—are non-negotiable.
Step 4: Use Attribution Insights to Increase Conversions
Alright—tracking is live, model is picked. Now use the data like a marketer, not like an accountant.
Here’s a concrete example of what changed for a course funnel after switching from last-click to a multi-touch, position-based approach.
Before:
- Paid social (Meta) drove a ton of traffic.
- Last-click attribution credited most enrollments to “Email” or “Search Branded.”
- So the team cut Meta spend because “it wasn’t closing.”
After:
- Multi-touch attribution showed Meta ads were often the first touch that started the journey.
- Blog content and email nurture were the middle/closing touches.
- When we kept Meta spend stable (instead of cutting it), enrollment volume increased because the funnel had more top-of-journey entries.
Numbers matter here. In one similar setup, we saw:
- Enrollment lift: +18% over 6 weeks
- Blended CAC: down ~12% (because we stopped starving the funnel)
- Email performance: improved once we aligned email offers to the content people actually viewed after ads
So what do you do with this?
- Reallocate budget based on contribution, not just last-click.
- Run split tests on the assets that appear in high-credit paths (for example, test two webinar landing pages or two “day 3” email CTAs).
- Keep messaging consistent: if an ad promises “template + walkthrough,” your landing page and email should echo the same promise. Otherwise you’ll get drop-off at the exact moment people are trying to decide.
One more thing: attribution can’t fully fix tracking gaps caused by cookie loss, cross-device behavior, and browser privacy changes. If you see weird swings, don’t panic—check your tracking QA again and look at trends rather than single-day spikes.
Step 5: Continuously Refine Attribution and Marketing Strategy
If you treat attribution like a one-time setup, you’ll get results that drift over time. Student behavior changes, platforms change, and tracking breaks in small ways.
Here’s how I run it in practice:
- Monthly: check conversion event accuracy (is enrollment still firing correctly?), review top campaigns by contribution, and confirm UTMs haven’t changed.
- Quarterly: compare how different models rank channels. If the “winners” flip wildly, investigate tracking quality and conversion volume first.
- Every launch: update your UTM schema and make sure new landing pages still inherit the same tracking patterns.
One pattern I’ve noticed: switching from last-click to position-based or time decay often reveals channels you previously undervalued. For example, you might discover that your “how to create an online course” blog post isn’t the final click—but it’s the first spark that leads to enrollments days later.
Don’t be afraid to experiment with more advanced methods when your data supports it. Markov chain attribution and Shapley value approaches can be useful for modeling pathways and incremental contribution—but only if you have enough conversion volume and clean event data. Otherwise, you’ll just be confident in the wrong story.
Bonus: Recommended Tools for Course Attribution Modeling
If you want to make attribution easier to run (and less manual), tools can help—especially for multi-touch reporting and mapping. For course marketers, I usually see people start with analytics + pixels, then add specialized tracking when they want deeper journey visibility.
For example, Platforms like Voluum and OWOX are commonly used for advanced tracking and attribution workflows. They can help you connect ad + email + onsite behavior into a more complete customer journey, so you’re not stuck with last-click limitations.
That said, tools don’t replace setup. I’d still recommend you verify your conversion events and UTMs first, then use the tool to analyze contribution and optimize faster. If you do it in that order, you’ll save a lot of time and avoid chasing phantom “performance.”
FAQs
Key touchpoints are the places where potential students interact with your course or marketing. Common ones are social media posts, email campaigns, landing pages, webinar pages, and referral sources. The goal is to track which touchpoints show up in the paths that lead to enrollments.
Start by thinking about your student journey. If enrollment happens quickly, last-click or time decay can work. If students typically research and need multiple nudges, choose position-based or multi-touch. If you have enough conversion volume, data-driven attribution can be more accurate—but only when your data is consistent.
Google Analytics (or similar analytics), Google Tag Manager, and ad platform pixels like Facebook Pixel are the usual starting point. If you’re running email, add UTM tracking to every link inside your emails. For deeper multi-touch reporting, specialized attribution tools can help, but only after your core conversion tracking is solid.